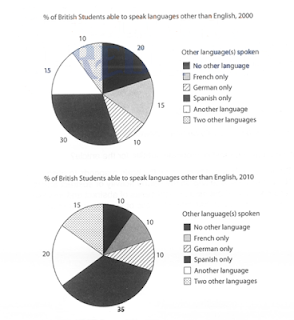
The charts below show the proportions of British
students at one university in England who were able to speak other languages in
addition to English, in 2000 and 2010.
Summarise
the information by selecting and reporting the main features, and make comparisons
where relevant.
The set of pie chart demonstrates the percentage of British
pupils who able to spoke different types of foreign languages at university in
2000 and in 2010.
Overall, the Spanish language was most popular between the
English undergraduates.
In the year of 2000, approximately one third of university
students were fluent in the Spanish language. The French language was second
most popular language. It accounted 15 percent. The percentage share of the
German language was only 10 %. The figure of other languages' speaker by the
learner at the college were same as the figure of German language speaker.
However, only 10% of sophomore were bilingual, which was almost half then those
who only speak English.
Over the time period one decade, there had radical changes
observed. The proportion of the Spanish language and other languages and the
bilingual students were rose by the 5 %. While, there was a significant fall seen
in the student who speaks the French language, from 15 % to 10%. The number of
students who only speak English decreased dramatically to the 10%. However, the
German language speaker were the constant.

Comentarios: